Europe

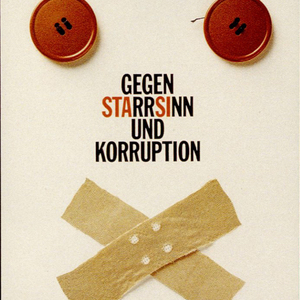
Against Pig-Headedness and Corruption
Poster criticizing the Stasi - the GDR secret police - prior to March 18, 1990 East German election in which voters overwhelmingly backed unification with West Germany.

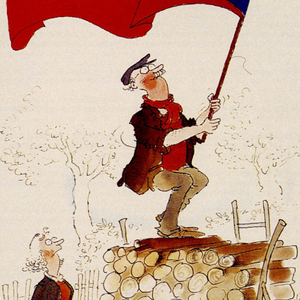
"...Climb Down and Get to Work!"
In Spring 1990, Czechoslovak artist and cartoonist Vladimir Rencin sends this message that is was time to stop the flag-waving euphoria surrounding the revolution's victory and to get to the hard work of rebuilding the country.

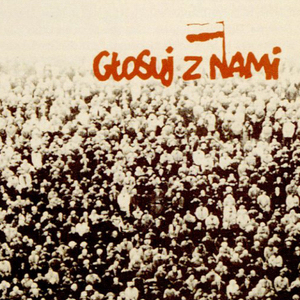
Vote With Us
A poster distributed by the Polish opposition party Solidarity, urging Poles to vote with them against the Communists in the election on June 4, 1989. Solidarity won the election in a landslide inaugurating the first non-communist government in East Central Europe in more than four decades.

45 Years is Enough!
While the world watched the events in Berlin, another Soviet ally in East-Central Europe suddenly collapsed: On November 9-10, after three-and-a-half decades in power, Bulgarian communist leader Todor Zhivkov was unceremoniously dumped.

Eastern and Central Europe After 1989
The nations formed following the break up of the Soviet Union. The Soviet Union is no longer on this map. It has been replaced by several new independent states—Moldova and Ukraine among them. The former Yugoslavia has also fragmented into several states.

Eastern and Central Europe After 1989
The nations formed following the break up of the Soviet Union. The Soviet Union is no longer on this map. It has been replaced by several new independent states—Moldova and Ukraine among them. The former Yugoslavia has also fragmented into several states.

The Regions of Contemporary Romania within its post-World War II Borders
The Map showing the political and administrative areas of Romania. While the borders have remained stable since 1945, some of the neighboring states have changed after the fall of communism in the area.

Romania and Its Neighbors
Modern map of Romania. Timişoara (Temesvar in Hungarian) has become more homogeneous during the 20th century, but remained a multi-lingual, multi-ethnic, multi-confessional city, closer in distance and perhaps culture to the Serbian (Yugoslav) and Hungarian capitals than to Bucharest.

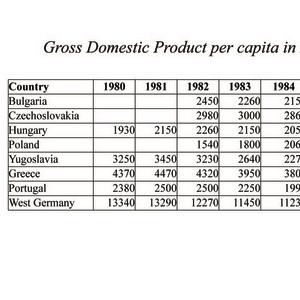
GDP in Eastern Europe: 1980-1989
The recession of the early 1980s caused significant disruptions in the economies of all European states, whether Communist (above the double line) or non-Communist. The data in this table show how even in West Germany, from 1980 to 1985 gross national product per capita decline across Europe.

Infant Mortality: Eastern Europe: 1970-1989
One of the most important indicators of a societies transition to what economists often call “modern industrial society” is a decline in infant mortality rates.