Witches
A data visualisation initiative by the University of Edinburgh, Witches is a beautifully presented project that maps information from the Survey of Scottish Witchcraft database (which by itself is already a fantastic resource) onto actual locations. This work was largely done by Emma Carroll across the span of three months during her time as a Data and Visualisation intern with the University. Correspondingly, users who would like to know a bit more about the process are more than encouraged to read her blog detailing each week of the project.
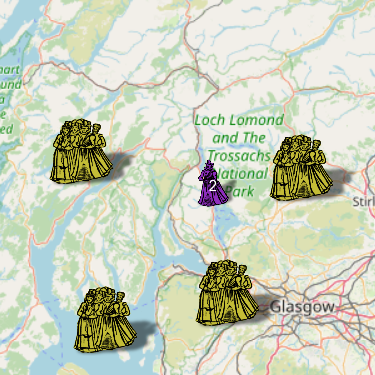
Upon arriving at the landing page for Witches, users are presented with a large map of Scotland and a number of tabs at the top of the page, as well as a filter. Using a combination of these tabs and filters, users are then able to explore the residences, detention locations, trial locations, and death locations of witches on various iterations of the map. There is also the option to view the peoples associated with some of the more well-documented witch trials, this including the journey of the ‘witch-pricker’ John Kincaid – responsible for “finding the Devil’s mark on witchcraft suspects” by pricking them with a pin.
Importantly, each tab comes with a very useful information pop-up that briefly details the data that’s being displayed. The Places of Residence for Accused Witches map (which is the first map users will see upon accessing the site), for instance, notes the total number of named accused witches and provides a short few lines about how the data was collected, as well as why some entries in the original database have been recorded in a certain way.
Maps aside, Witches has also provided an interesting set of additional data visualisations for areas such as the occupations of the accused, types of torture they endured, and what kind of trial ordeals took place. In most instances, users are able to view this information in different visualisations e.g. as a table or bar graph.
Perhaps one of the most interesting aspects of Witches can be found in the Story of Isobel Young, which is a short storymap that uses the collected data to explore the life and death of a woman who had been accused of witchcraft. Providing historical context and illustrations from that period in one panel, and a map of where each action took place in another, this storymap provides an engaging example of how good data visualisation can add new dimensions to historical research. While not the main point of the site itself, it would have been great to see more stories like those of Isobel Young’s being told using the same format.
Given that the data in Witches can be overlaid on both modern or historic maps, Witches provides some excellent teaching material for teachers of both geography and history. Using the data provided, students can be asked to reconstruct a day in the life of one of the accused witches or even the accusers themselves. This can then be linked to broader lessons about religion and social structures of the day. The inclusion of information for male witches also provides an interesting starting point to discuss prevailing notions/understandings of witchcraft and their accuracy.
Overall, Witches is well-conceived and equally well-presented project that takes our understanding of Scottish witchcraft one step further. Being able to visualise locations in this manner provides a useful and indeed, necessary dimension to the data that we already have on this period and these people. Easy to use, well laid out, and thoughtful in design, Witches promises to add much to classrooms or upcoming research projects.
