Map and Population Table for British Gambia, 1915-1918
Annotation
Many people in West Africa fled across colonial boundaries to avoid military conscription in the late 19th and early 20th century. For example, during World War I, tens of thousands of people left the French colony of Senegal for neighboring British Gambia and Portuguese Guinea-Bissau.
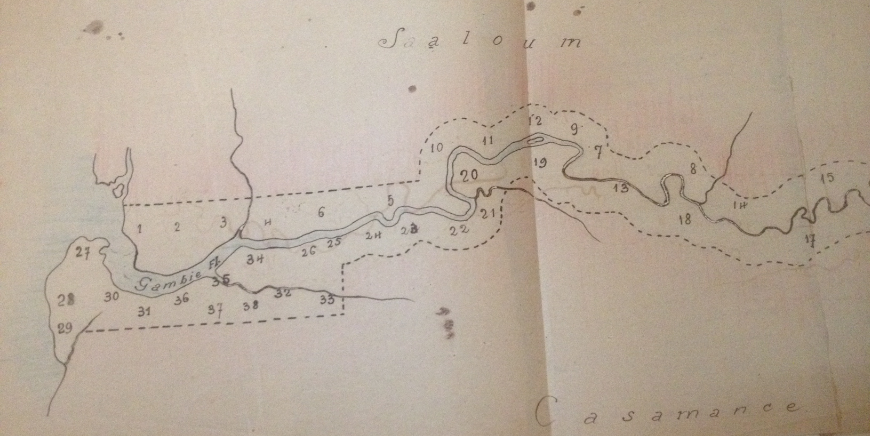
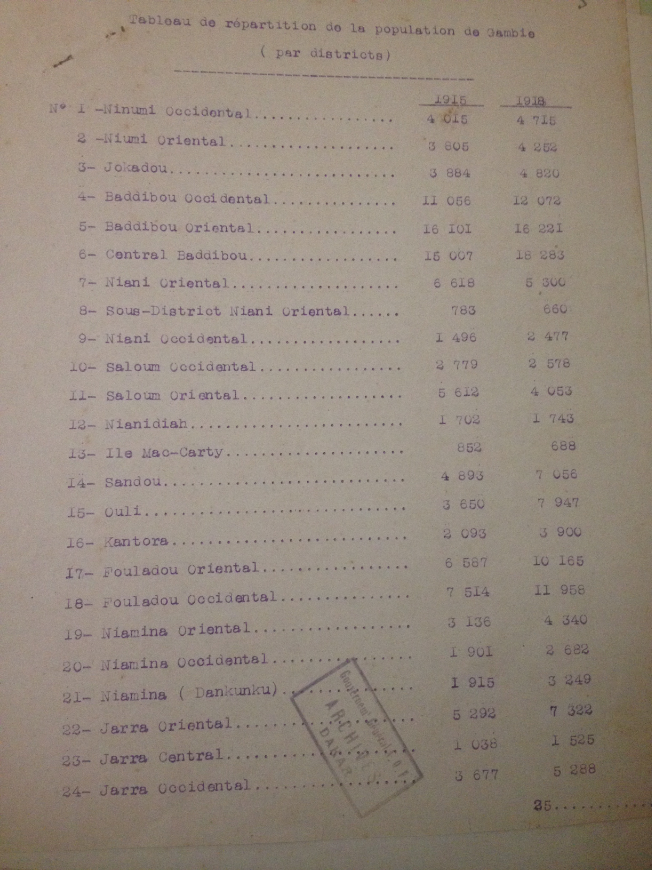
The primary sources are a map of British Gambia, with districts marked, and a table showing the population of different districts in 1915 and 1918. While population figures were imprecise due to the difficulty of conducting accurate censuses, the figures in this table show the rise in population in different regions of Gambia from 1915 to 1918, as French military conscription activities led many to flee to neighboring regions. Contemporary sources show that the French actively sought to employ British assistance in returning “deserters” who had fled French territory. The British, while open to aiding the French, did not have sufficient power to limit the influx of those from neighboring Senegal, and were also happy to see their population rise, as it increased their ability to collect taxes and raise agricultural production.
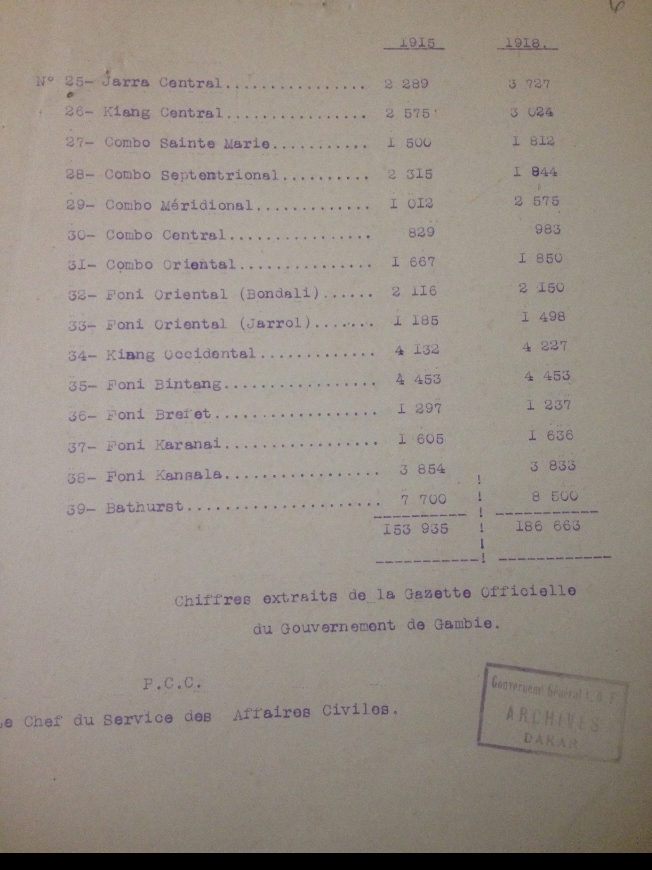
The two easternmost districts in Gambia, Wuli (Ouli), number 15 on the map and table, and Kantora, number 16 on the table, and just off the map to the right, saw their populations roughly double during the three years of the war. In contrast, the capital of Bathurst, number 39 on the table and 27 on the map, saw a rise in population of just over 10 percent, while most districts of Kombo (Combo), just outside the capital and numbers 27 through 31 on the table and the map, saw similarly small increases. In all the table shows a jump in population from 153,935 in 1915 to 186,663 in 1918. While the entirety of Gambia was a borderland, surrounded by Senegal on all sides, the areas furthest from centers of power like Bathurst were the ones that saw the opportunity for the greatest mobility. Those areas more closely tied to colonial power were sites of greater surveillance, and often places where national cultures began to develop, separating those in Gambia from their kin in Senegal.
These patterns were not just at work in Senegal, but across French West Africa. In the district of Koumbia, the northwesternmost region of French Guinea saw 4,000 people leave for neighboring Portuguese Guinea during a 1918 recruitment drive. This was part of a larger exodus of people from Koumbia, whose population of taxable individuals dropped from 70,000 in 1912 to fewer than 55,000 by 1919.
Transcription
Tableau de répartition de la population de Gambie
(par districts)
The many uses and meanings behind material objects make them valuable tools for exploring the past.
1915 1918
1 - Ninumi Oocindental 4015 4714
2 - Ninumi 3606 4252
3 - Jokadou 3884 4820
4 - Baddidou Oocindental 11056 12072
5 - Baddidou Oriental 16101 16221
6 - Central Baddidou 15007 16283
7 - Niani Oriental 6618 5300
8 - Sous-Distrit Niani Oriental 783 660
9 - Niani Oocindental 1496 2477
10 - Saloum Oocindental 2779 2578
11 - Saloum Oriental 5612 4053
12 - Nianidish 1702 1743
13 - Ille Mac-Carty 852 688
14 - Sandou 4893 7056
15 - Ouli 3650 7947
16 - Kantors 2093 3900
17 - Fouladou Oriental 6587 10165
18 - Fouladou Oocindental 7514 11958
19 - Niamina Oriental 3136 4340
20 - Niamina Oocindental 1901 2682
21 - Niamina (Dankunku) 1915 3249
22 - Jarra Oriental 5292 7322
23 - Jarra Central 1038 1525
24 - Jarra Oocindental 3677 5288
25 - Jarra Central 2289 3727
26 - Kiang Central 2575 3024
27 - Combo Sainte Marie 1500 1812
28 - Combo Septentrional 2315 1844
29 - Combo Méridional 1012 2572
30 - Combo Central 829 983
31 - Combo Oriental 1667 1850
32 - Foni Oriental (Bondali) 2116 2150
33 - Foni Oriental (Jarrol) 1185 1498
34 - Kiang Occidental 4132 4227
35 - Foni Bintang 4453 4453
36 - Foni Brefet 1297 1237
37 - Foni Karanai 1605 1636
38 - Foni Kansala 3854 3833
39 - Bathurst 7700 8500
153935 186663
Chiffre extraits de la Gazette Officielle
du Gouvernement de Gambie
P.C.C.
Le Chef du Service des Affaires Civiles
Credits
“Mouvement d’émigration des populations du Sénégal et du Soudan vers la Gambie,” From Minister of the Coloniest to the Governor-General of French West Africa, October 2, 1918.
Location: Archives Nationales du Sénégal, Dakar, Senegal
Folder: 1F13