Analyzing Census Data

Overview
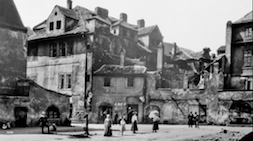
The modules in Methods present case studies that demonstrate how scholars interpret different kinds of historical evidence in world history. In the video below, historian Mills Kelly discusses the data from the 1910 census of the Hapsburg Monarchy. The census data was collected for most towns and cities throughout the Monarchy every few years from between 1880 and 1910. It covers occupation, disease, language, and literacy for men and women separately. Kelly also discusses a rare photograph of women from Bohemia. Information about women during this period is especially difficult for historians to uncover, and these sources can provide valuable insights into women’s daily lives. As you view the video consider: What kinds of information can you gather from the census data alone? What can data on tuberculosis say about women’s social status and daily activities? What can you determine about women’s lives from data on literacy and occupation? What other sources might you use to draw conclusions about women’s lives in Bohemia in the late Hapsburg Monarchy? The primary sources referenced in this module can be viewed in the Primary Sources folder below. Click on the images or text for more information about the source.
Video Clip Transcripts:
1. What can you learn from census data?
When I set out to be a historian, I never thought that I would spend a lot of time reading census data. The problem that I confronted in my work on nationalism in the Hapsburg Monarchy is that the average person in the late 19th and early 20th century is largely invisible. We often have to rely on what journalists said about the working class or about rural women. We have to rely on what members of Parliament said in their speeches which, of course, are highly tinged by their political programs. We have to rely on memoirs of members of the elite describing their interactions with common people. Or we have to rely on a very small number of memoirs or surviving letters that average people left behind. And this gives a really incomplete picture. So I turned to census data in an attempt to try to reconstruct, at least partially, the lives of average people. Most historians use some kind of numbers in their work. Political historians use election returns. Social historians use social data produced by census authorities and others. Economic historians, of course, live in a world of numbers. Students need to understand that historical scholarship is largely informed by data—especially historical scholarship of the modern period meaning 18th, 19th, and 20th centuries—because of trends in the historical profession, but also because the data get better. So, for instance, any estimate of death as a result of the bubonic plague is truly an estimate based on some sophisticated guessing. Estimates of death by tuberculosis in the Hapsburg Monarchy are based on very good data. I began looking at census data with the advent of the modern Austrian census in 1880. Then, it’s gathered consistently from 1880 up until 1910, which was the last census in the Empire before the First World War and then the Empire falls apart in 1918. You can learn a number of things about the voters from these materials. You can learn how literate the voters were. You can learn what kind of employment they engaged in. You can learn how their lives were affected by various diseases, like tuberculosis. You can learn to a limited degree what their national identity was. The Hapsburg Empire was a multinational state. The people of the monarchy spoke 17 different languages. No single group was the dominant national group. The Germans made up about a third of the population, the Czechs about a quarter of the population, the Poles almost 20 percent of the population. Then various other Slavic groups like the Slovenes and the Serbs and the Croats together made up somewhere in the vicinity of 20 percent of the population. And then there were small groups of Italians and Jews and others. So in the census data, people are not asked, “What is your national identity?” “What is your national group?” Instead, they are asked, “What language do you most commonly use?” And so if you identified your language of everyday use as Czech, then today we use this as a proxy for Czech. Or if you said Slovene, then we say that that’s a proxy for Slovene. By 1880, this is a very reasonable proxy for national identity because the census taking became politicized. Political leaders in all of the various ethnic groups in the monarchy urged their people to answer correctly. If you were a Czech and you didn’t say Czech on your census form, you were betraying your nation. So you learn many things about their lives, but you learn it only in aggregate because these data don’t provide us with individual snapshots of individual lives. They tell us about the people who lived in Prague or the people who lived in Kolín or the people who lived in PÞibram. So we only know about large groups of people. It’s a collective biography of the workers in this sense or of the common people or of the voters. It’s not an individual biography.Video Clip Transcripts:
2. What can you learn about women from these data?
Gender plays an important role in what you can learn because all of these data, with a few exceptions, are reported both for men and for women. Women are especially invisible in this period of time. Women left far less information about their lives behind. Women in the Hapsburg Monarchy could not vote. It’s possible to reconstruct the employment picture of women at a district-by-district level, instead of the whole province of Bohemia—I can look down into individual districts like the city of Prague or a rural district like Semil. In 1910, the adult population of Prague, this means those over the age of 18, was 223,737 of which 118,524 were female. So women constituted 53% of the population of Prague. Of those 118,524 women, 22,045 of them were listed by the authorities as engaged in self-employed pursuits. This could be anything from owning their own shop to being a professional. There were, in fact, women lawyers in the Austrian monarchy by 1910. Not very many, but there were a couple. It could mean that they were street vendors. It could mean many different things. It could mean also that they were engaged in agriculture. If we look at industrial workers, 24% of the industrial workers in Prague were female, which is actually a very high percentage at this time. Those engaged in household work, meaning cleaning, nannying, cooking, that sort of thing, 99% of them were female. Not very many men engaged in household work. Of those who were unemployed, meaning that they had no profession to answer on the form, 71% of them were female.Video Clip Transcripts:
3. What are some limitations of census data?
All this information was hand gathered and then hand collated and hand added and subtracted and divided, and so one of the challenges of working with this kind of data is that you have to check their math. Those who were listed as “without occupation” in the Austrian census are those who had no identifiable occupation, meaning that they were not working for pay. But it could include somebody who was 90 years old or a mother who’s just had a child. Often people would identify their occupation even if they weren’t currently working. So these are people really occupation-less and there’s no way to know what they were doing with their time. That’s where then we run into the limits of what the data can tell us. We get down to a certain point and we can’t penetrate any deeper. We don’t dispute the quality of the data, but it’s still only data. So, for instance, if we look at the Prague suburb of Smíchov, 44,269 people are listed as industrial workers. This is a relatively high share of the population because Smíchov was an industrial suburb of the city. This is where the particularly stinky enterprises were, like coal and steel. There was a fair amount of leather tanning that went on there as well. Very unpleasant odors coming from these various factories which is why it was a suburb instead of in the city. So we know that there were lots of industrial workers in Smíchov. We also know that the population of Smíchov increased between 1880 and 1910 by something like 800%, so it was one of those industrial districts that grew phenomenally as industrialization took off in the monarchy. Then what you have to do is go back to other kinds of sources in the archives, things like reports by the chambers of commerce about industrial investment. Banking information is especially useful. You can look at banking records to see what kinds of enterprises they were supporting and how profitable some of these enterprises were. Then you can also find journalistic accounts of life in Smíchov. There were several local newspapers that were produced there. The Prague newspapers covered this district very extensively, whether it was political life, cultural life. And then you look at the activities of the political parties because the political parties in the Hapsburg Monarchy were much more pervasive in everyday life than political parties are today. Political parties provided not only a political network, but they provided a social and professional network for their members. You would obtain your health insurance through your political party, rather than through an insurance agency. You would take adult education courses. You would attend cultural lectures. You would belong to a hiking club that was sponsored by the party. I end up using all of these other kinds of manuscript sources to combine with the data. But I start with the data because the data often pose really interesting questions about what’s going on in a particular location.Video Clip Transcripts:
4. How do you teach students to analyze census data?
Students look at a report like this particular report on disease and death in the Austrian Empire in 1910 and roll their eyes because it looks very boring. It is a series of categories or columns. One of the skills that I try to teach my students is how to work with numbers. Their life is pervaded by data. One of the things that students need to learn is how to manipulate that kind of data. But they also need to learn how that data was collected and then pulled together into some form that’s given to them. Often it’s given to them in very problematic ways in the news media. So it’s a useful skill both as a historian, but as an educated citizen. If we’re trying to figure out about what the lives of women were like and these women are largely invisible, we can turn to data like these to try answer some of those questions. So, for instance, the report that I’m looking at is from the year 1910 and it’s a report on the causes of death in the population. And these causes of death include those who were born with crippling illnesses, those who had tuberculosis or other lung disorders. Those who had diphtheria, typhus, cholera. Those who died in childbirth, as a result of suicide, those who were killed in some sort of a criminal activity, those who died as a result of heart disease. So there are 25 different categories of death in this table. The state has [a] very important interest in death because death occurs for a whole variety of reasons which dictate social policy. If death was by murder in increasing numbers, the state needs to do something about that because there’s a crime problem. In late-Hapsburg Austria one of the things that the state was especially concerned about was a growing suicide rate among the population. In the city of Prague in 1910, 599 women died of tuberculosis as compared to 723 men. Women constituted 53% of the population of the city and so women were significantly less likely to die of tuberculosis than men. This is not especially surprising because tuberculosis is a disease that you acquire out in public. It’s communicated through coughing and other forms of human contact, especially by people who are in close proximity to one another. Men were engaged in the kind of labor in greater numbers that brought them into close proximity with one another. They spent a lot more time in the pub than women did. And women tended to stay home in larger numbers and so were less likely to acquire tuberculosis. But if we compare that to, for instance, the district of Böhmisch-Leipa, 103 women died of tuberculosis as compared to 90 men. And in the same district, women constituted 54% of the population. And so something’s different there. And this is the kind of question that you can ask students to then try to figure out. What do we know about Prague? It’s a big city, so we know a lot about Prague and students can find this fairly easily. Böhmisch-Leipa, first they have to find it on a map. It’s not that hard to do and the first thing that they notice is that it’s a rural area. This, then, causes them to ask questions about why in an industrial center like Prague, women would be less likely to acquire tuberculosis where in a rural area like Böhmisch-Leipa, they would be more likely to acquire tuberculosis. And so then they have to start investigating rural hygiene and the spread of tuberculosis in rural areas. And they have to do this through many other different kinds of sources. But the data start them with a question and then they go off and try to answer that question. The limitations of this data, of course, are many. We know that in this district of Böhmisch-Leipa, women were more likely to die of tuberculosis. It doesn’t tell us why. It doesn’t tell us how the data were collected. It doesn’t tell us who were responsible for issuing those death certificates and determining that it was tuberculosis as opposed to a case of the flu which had a cough also. They weren’t doing blood tests for tuberculosis. I ask students all the time because they often look at numbers and say, “Oh, these are facts.” These are real facts or authentic facts or indisputable facts. And so I let them first start building some set of questions out of the numbers. And then once they’ve built that set of questions, then I make those numbers the problem. And then they start thinking, “Oh, well, we can’t really know anything from this.” And then you kind of negotiate between their idea that these are facts and their concern that maybe none of these numbers are very accurate. And somewhere in the middle is a very interesting set of questions that they can then work from.Video Clip Transcripts:
5. What can students learn from literacy data?
Another example of the way that I use these data to get my students to ask some interesting questions about the lives of women in the past comes from the literacy data. So I use the 1900 data. And the example that I give them comes from a literacy report. It reports how many people can read and write, how many people can only read, how many people simply know their alphabet, and then a total. And then within that, it breaks it down further according to the size of the city that they live in or the size of the district that they live in. So it’s possible to compare literacy rates in a big city like Prague to literacy rates in the smaller, more rural areas like Böhmisch-Leipa. In the city of Prague about 80%, 85% of the population of the city can read and write. A few can only read and then the rest know their alphabet, with the exception of a very small number who don’t even know their alphabet, less than a percent. In Prague, women constitute 52% of the population that can read and write and they constitute 53% of the population. So women in Prague are fully literate in the same way that men are fully literate. But if we look at Böhmisch-Leipa the picture is quite different. So if students compare an urban area to a rural area, they find that in the rural areas, women are less literate. They can start looking at this report and see that the smaller the district is, the more likely women are to be illiterate. And so, then, this causes students to ask the question of, "Well, why would that be?" If there is mandatory primary schooling throughout the state, why would it be that women would be more illiterate in these rural areas than they would be in urban areas. I give them a small subset of these numbers to look at. Several urban districts, several rural districts. And then they start asking these kinds of questions. And then they have to go off and try to answer them through other kinds of sources. There are lots of other sources that speak to this, but the numbers often begin the process of investigation. What they come up with is that rural society tends to be more traditional and so there is resistance to women taking on more modern roles. They are discouraged from education to a greater degree in rural areas than in urban areas. In urban Austria in the late 19th century, the population across the various national groups and across the provinces was aggressively modernizing. There was really a competition among the various national groups to see who could get ahead fastest and fight for the resources to make that possible. But in the rural areas, there is more sort of a traditional approach.Download Full Video Transcript
Videos


Primary Sources
Women from Bohemia
Annotation
Census of 1910 tuberculosis data

Annotation
Credits
T. Mills Kelly is Professor in the Department of History and Art History at George Mason University and is Associate Director of the Center for History and New Media. He is a specialist in late-Habsburg history with a particular focus on radical Czech nationalism, and is the author of numerous articles on this subject, and a book entitled Without Remorse: Czech National Socialism in Late-Habsburg Austria.